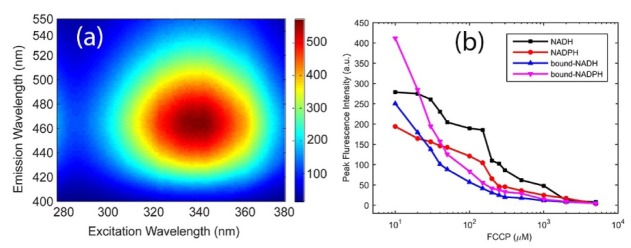
Fig. 1.
(a) Excitation-emission matrices (EEM) of the 50 µM NADH solution (b) Peak fluorescence intensity of free NADH and NADPH versus FCCP concentration(10 −5000 µM). Peak fluorescence intensity values for free NADH (black square), free NADPH (red circle), bound NADH (blue triangle) and bound NADPH (magenta triangle) are, respectively, 534, 352, 306 and 626. These data points could not be presented in Fig. 1(b) due to the log scale used in the plot.

