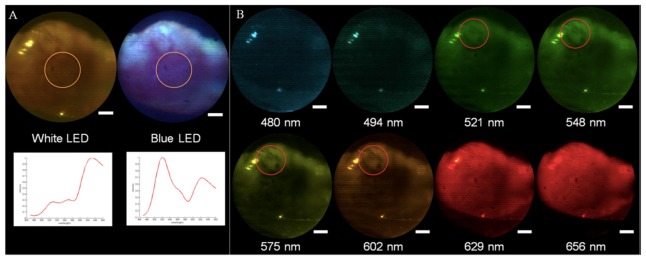
Fig. 7.
Images acquired by the endomicroscope of a biopsy showing invasive oral SCC in widefield spectral mode when illuminated by the white and blue LEDs, where the scale bars are equivalent to 500 μm. Beneath the images are plots of the associated spectra of these two images, which were found by taking the average of the measured spectra of the an area 1 mm in diameter at the center of the fields, (indicated by an orange circle). The vertical axis of the chart is intensity (arbitrary units) and the horizontal axis is wavelengths (from 460 nm to 660 nm) (A). Reflectance images of the biopsies at eight different wavelengths, (pseudocolored to match the represented wavelengths) showing enhanced viszualitzion of vessels at 548 m, and 575 nm (areas identified by the red circles), where hemoglobin absorption is maximal - the scale bars are equivalent to 500 μm. (B).

