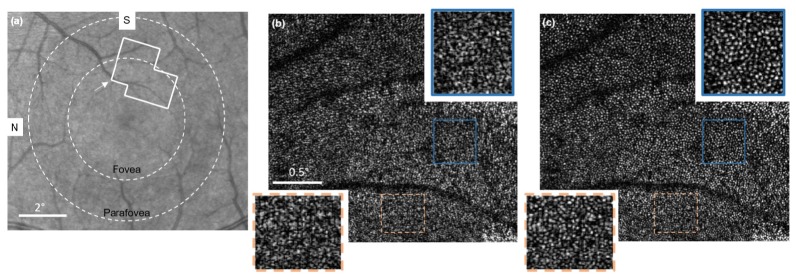
Fig. 10.
Fovea images of the living human retina. (a) A fundus image showing the location of the acquired en face OCT data. (b) Original en face OCT data. (c) En face OCT data after CAO. N, nasal; S, superior. Scale bars represent 2 degrees in (a) and 0.5 degrees in (b, c). Figure adapted from [124].

