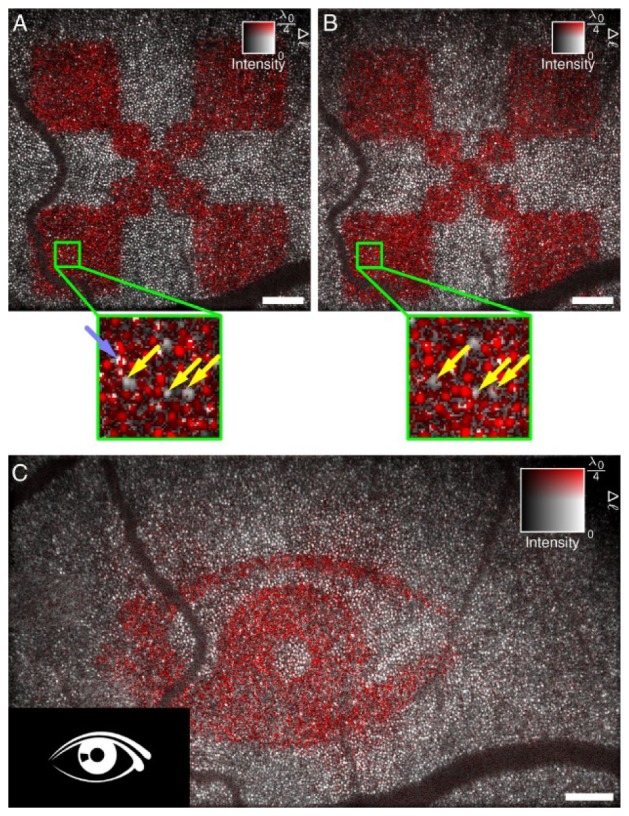
Fig. 11.

Retinal imaging and response to an optical stimulus. After computational aberration correction, optical path length changes Δℓ can be resolved in individual cones. (A and B) Measurements of independent responses were about 10 min apart. Light stimulus was 3 s for both cases. Most cones reacted to the stimulus, but some exhibited only a small or no response and are indicated by yellow arrows. Some locations pointed by the light blue arrow show abrupt phase changes within a single cone. (C). The proposed technique shows the capability of identifying more complicated stimulation patterns and indicating which photoreceptors contribute to an image seen by the test person. Scale bars represents 200 μm. Figure adapted from [135].
