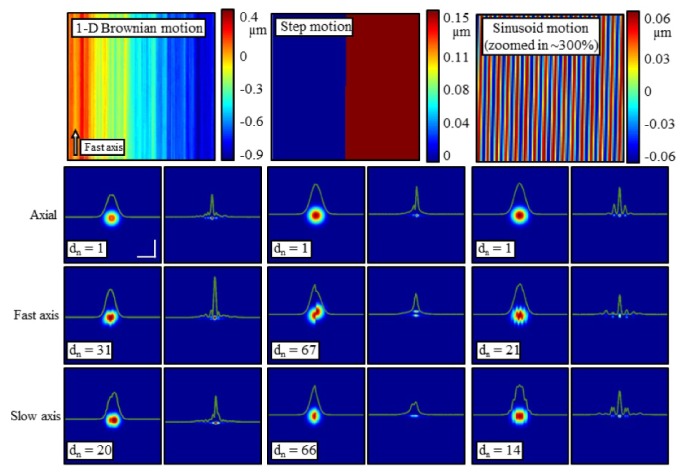
Fig. 12.
Simulation of a single point scatterer showing the impact of 1-D Brownian motion (left column), step motion (middle column), and sinusoidal motion (right column). The motion maps in the top row were applied along the axial dimension (second row), fast axis (third row), and slow axis (final row). Within each column, the left image shows the OCT en face plane, while the right image shows the result of computational refocusing. The magnitude of the motion applied is scaled by dn for each image to achieve a representative artifact. The simulation was performed at a central wavelength of λ0 = 1.33 µm. Scale bars represent 50 µm. Reproduced from [138].

