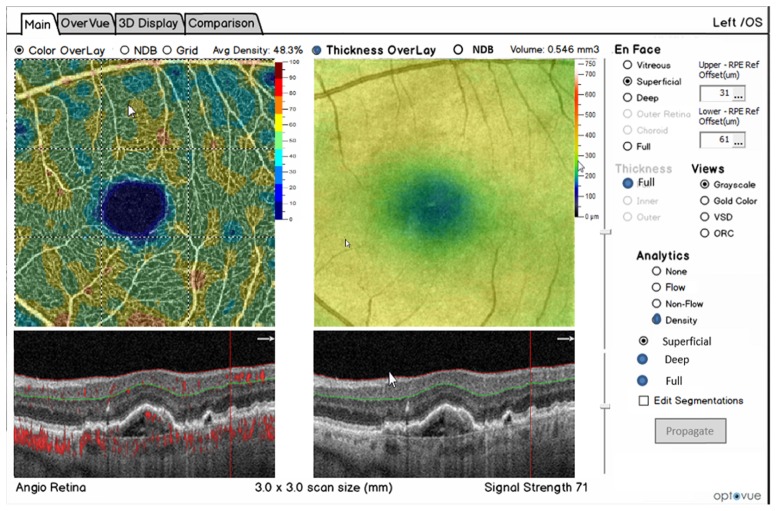
Fig. 12.
Screen shot of one view of the Optovue commercial AngioVue ophthalmic SD-OCT product. The top left shows the OCT-A en-face view of micro-capillary network of blood flow. The upper right shows an OCT en-face with a retinal thickness map. The lower right shows a cross sectional B-scan with automated segmentation of a layer shown in green. The lower left shows a cross sectional view of both structural and OCT-A flow information. Image courtesy of Optovue.

