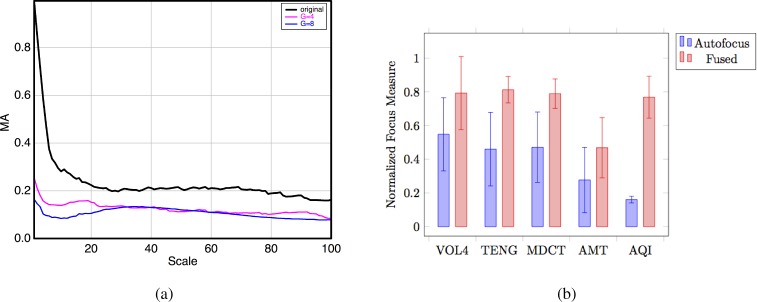
Fig. 4.
(a) The Angular Measure Spectrum produces a scale-spectrum that reflects the signal complexity on all possible scales simultaneously. The figure represents the AMT spectrum corresponding to a TB autofocus image (labeled ’original’) and defocused images with Gaussian blur (σ = 4; σ = 8); (b) Normalized focus measures of the 30 selected stacks corresponding to the autofocused and multifocus fused images. Bars represent mean values and error bars the standard deviation.

