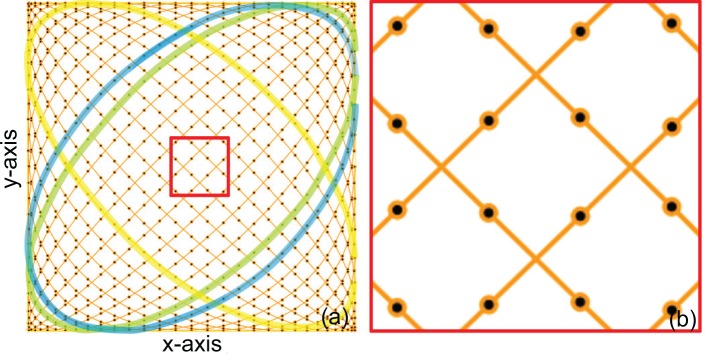
Fig. 1.
Example of a Lissajous scanning pattern containing 64 A-lines per single horizontal cycle (n = 64) (a) and its magnified image in the center region (b). The black dots on the scanning trajectory represent A-line sampling points. The yellow, green and blue curves are examples of a single horizontal cycle. The green and blue curves are adjacent horizontal cycles.

