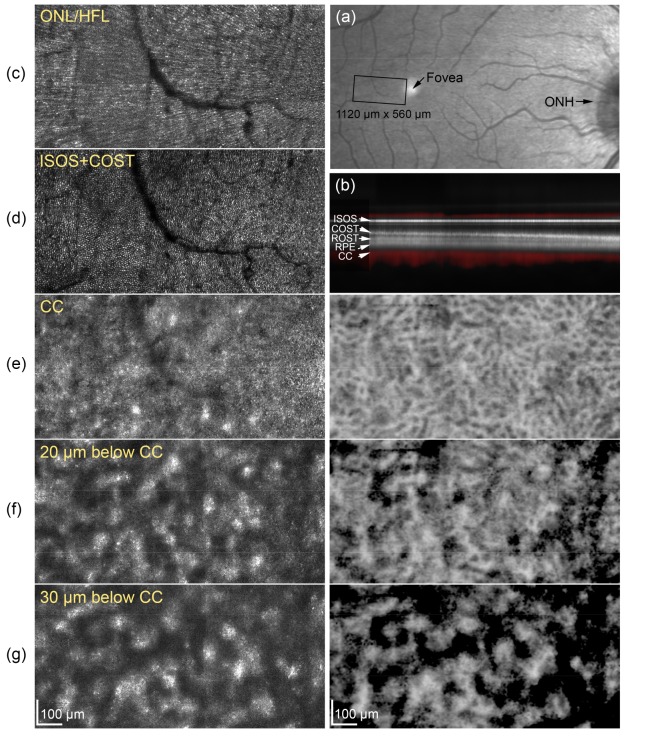
Fig. 2.
Comparison of intensity and angiographic maps of the wide-field collage constructed from AO-OCT volumes of the retina and choroid of subject G. (a) Wide-field SLO image from Heidelberg Spectralis denotes location of 4° × 2° AO-OCT collage, (b) The superposition of AO-OCT (in grey) and AO-OCTA (in red) B-scan projections indicate depth location of each band. En face images of intensity (left) and angiography (right) are shown extracted from the AO-OCT volume at (c) ONL-HFL interface, (d) IS/OS + COST, (e) CC, (f) 20 μm below CC, and (g) 30 μm below CC. Visualization 1 (10.4MB, AVI) shows an en face side-by-side fly-through of the AO-OCT and AO-OCTA volumes with projected B-scans to mark depth location.

