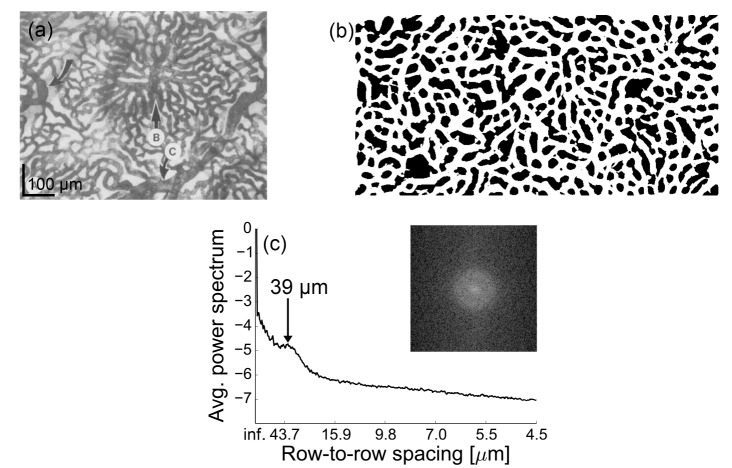
Fig. 3.
(a) A representative histologic section of CC at posterior pole of adult human [5] is shown for comparison and scaled to AO-OCTA en face images in Fig. 2. (b) Binary image is generated from CC angiographic image in Fig. 2(e) and used to determine normalized capillary density and capillary length per area. (c) Greyscale and circumferential average of two-dimensional power spectrum of CC angiographic image in Fig. 2(e).

