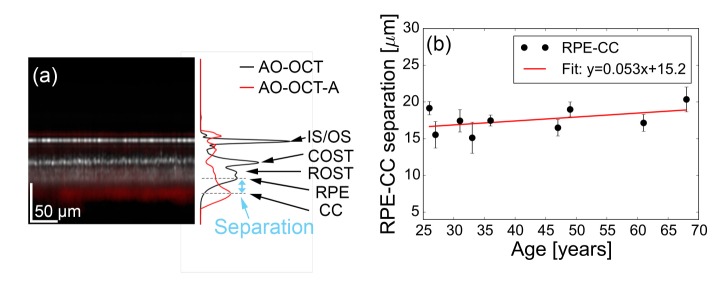
Fig. 5.
RPE-to-CC depth separation. (a) Representative AO-OCT intensity (gray scale) and AO-OCTA (red scale) B-scan projections and averaged A-scan profiles are shown superimposed. Volumes were acquired 3° temporal to the fovea of Subject G. (b) RPE-to-CC depth separation for the nine subjects is plotted against age with error bars denoting the standard deviation of measurements across retinal eccentricity. Red line is the linear regression fit.

