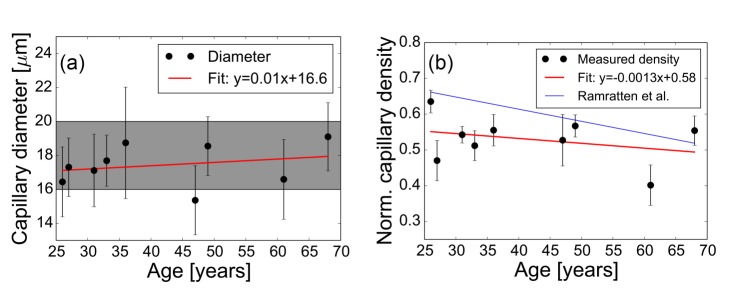
Fig. 7.
(a) Capillary diameter and (b) normalized capillary density as a function of age. Error bars denote the standard deviation of measurements across retinal eccentricities. Red lines are the linear regression fits. For comparison in (a), the gray background indicates the capillary diameter range reported in the histologic study of Olver et al. [40]. For comparison in (b), the blue line indicates the linear fit reported in the histologic study by Ramrattan et al. [1].

