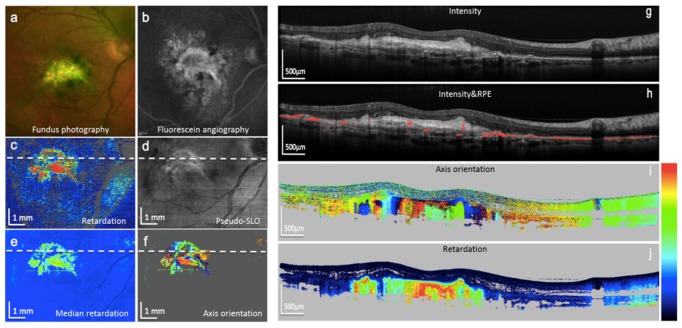
Fig. 18.
Images of an eye with fibrotic neovascular AMD. (a) Color fundus photo; (b) fluorescein angiography; (c) PS-OCT mean retardation map; (d) PS-OCT reflectivity projection map; (e) PS-OCT median retardation map; (f) PS-OCT axis orientation map; (g) PS-OCT reflectivity B-scan; (h) same B-scan with segmented RPE (red); (i) PS-OCT axis orientation B-scan, fibrotic tissue generates column-like color pattern (color bar: −90 - + 90°); (j) PS-OCT retardation B-scan, fibrotic tissue is strongly birefringent (color bar: 0 – 90°). (Adapted from [126])

