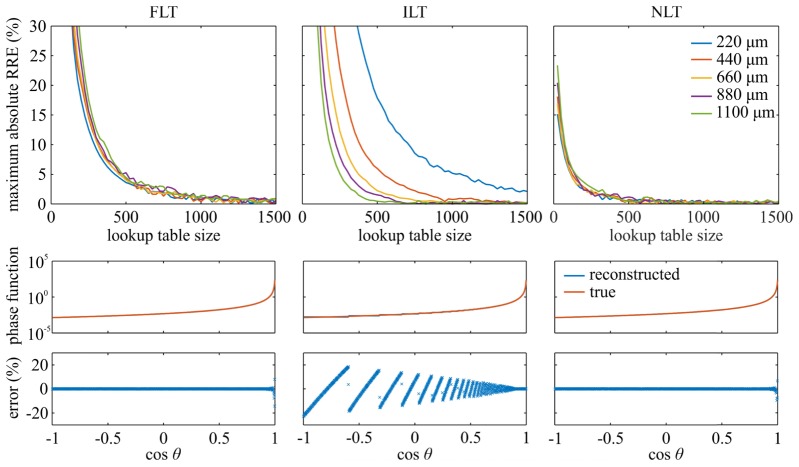
Fig. 5.
(top row) Maximum absolute RRE as a function of the lookup table size used by the numerical sampling methods (FLT, ILT and NLT). (middle row) Comparison between the reconstructed and the corresponding true GK phase function obtained by different numerical sampling methods using the lookup table sizes from Table 2. (bottom row) The relative errors of the reconstructed GK phase functions.

