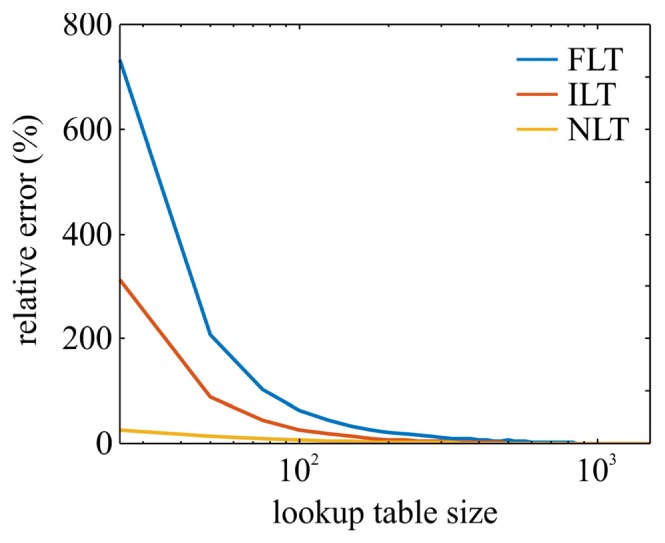
Fig. 9.

The average relative error within 50 bins of the reconstructed phase function histograms from Fig. 5 that represent the contribution of small scattering angles (cos θ between 0.9 and 1) as a function of the lookup table size for each numerical sampling method (FLT, ILT and NLT).
