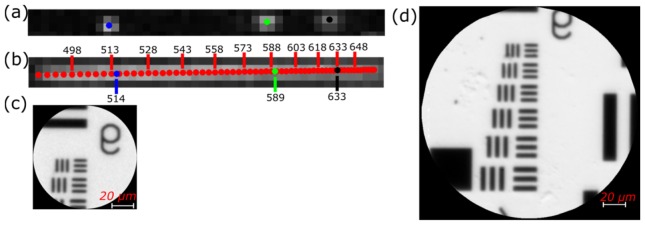
Fig. 8.
Reconstruction of images for LATIS. Fig. (a). The spectral response of three narrow band filters with a 1-nm spectral bandpass. Each marker (blue, green, black) represents the centroid for each narrow band filter imaged. Fig. (b). Using the calculated centroids, wavelength positions are interpolated (represented by red markers). Due to the prism’s nonlinearity, pixel sampling of the spectrum is also nonlinear. Fig. (c). Reconstructed panchromatic image of a resolution target acquired with the tunable LATIS. Fig. (d). Reconstructed panchromatic image of a resolution target for the static LATIS. The FOV is larger due to the greater number of spatial samples (200x200 vs. 88x88).

