
Fig. 9.
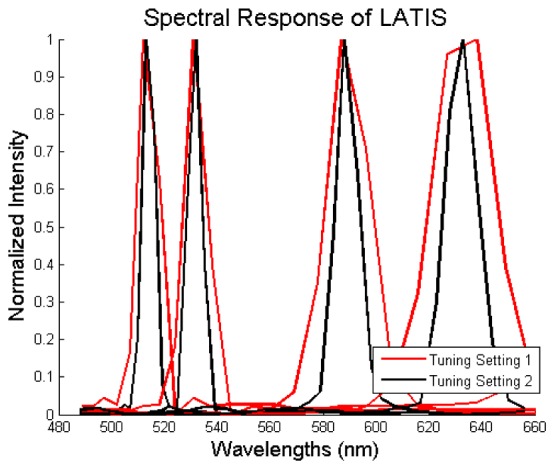
The mean spectral response for all spatial points at 514 nm, 532 nm, 589 nm, and 633 nm. The red lines represent the spectral response at tuning setting 1, and the black lines represent tuning setting 2.
Official websites use .gov
A
.gov website belongs to an official
government organization in the United States.
Secure .gov websites use HTTPS
A lock (
) or https:// means you've safely
connected to the .gov website. Share sensitive
information only on official, secure websites.
The mean spectral response for all spatial points at 514 nm, 532 nm, 589 nm, and 633 nm. The red lines represent the spectral response at tuning setting 1, and the black lines represent tuning setting 2.