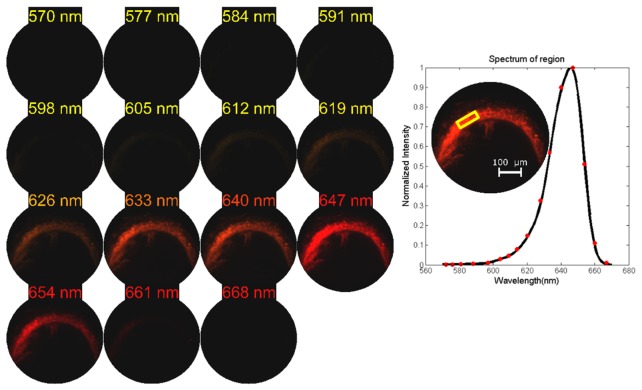
Fig. 13.
Quantum dot imaging of sectioned lymph node mouse tissue using the static LATIS. Using the 570 to 670 nm bandpass filter, the datacubes acquired were 200x200x17. Fifteen spectral channels of the 17 channels are displayed. The averaged spectrum for the region boxed in yellow is plotted. Red markers indicate pixel values and the black lines are interpolated values.

