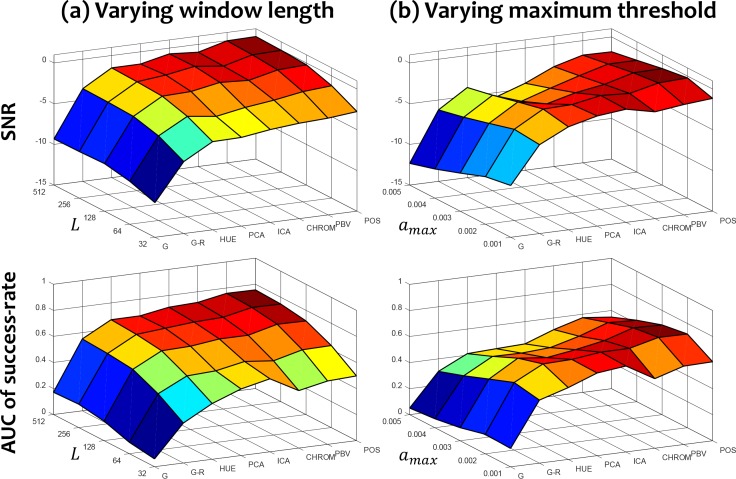
Fig. 9.
The 3D mesh shows different SNR (first row) and AUC of success-rate (second row) when varying the parameters of ASF for eight rPPG algorithms. The two varied parameters are: the sliding window length L (first column) and the maximum amplitude threshold amax (second column). When changing the investigated parameter, the other one remains constant. The red/blue color represents the high/low values for SNR and AUC of success-rate.

