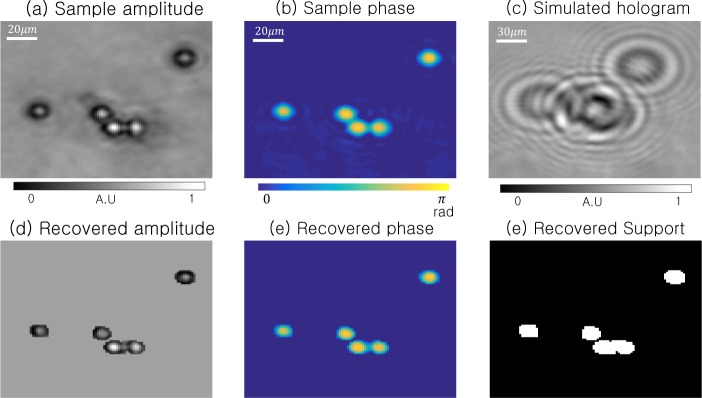
Fig. 3.
Simulation of standard in-line holography for a set of 5 microspheres. (a)–(b) Simulated sample’s original amplitude and phase, leading to (c) detected hologram intensities at sensor plane (d = 1 mm). (d)–(e) Recovered amplitude and phase using the ER phase retrieval algorithm (updating all pixel amplitudes). (f) The final sample support.

