Fig. 10.
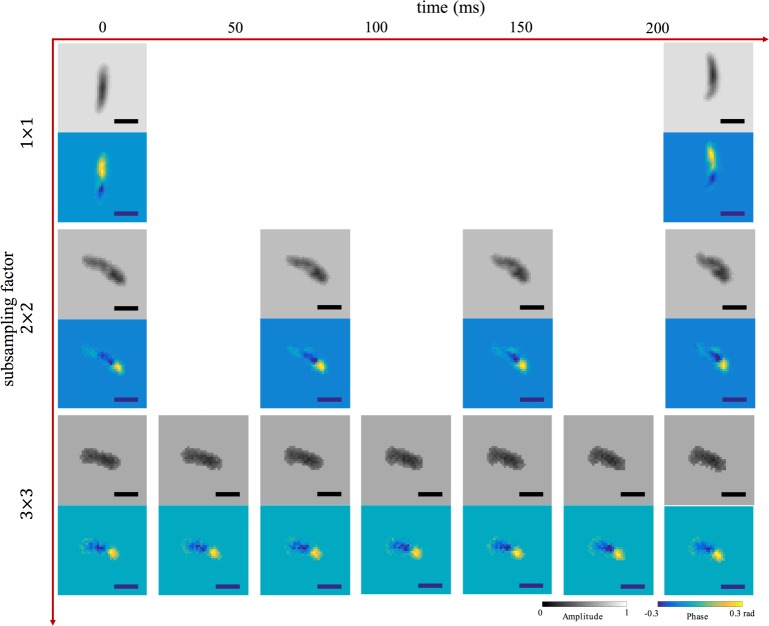
Example: subsampled holographic reconstruction of in vivo Peranema in motion (subsampling factor vs. time). Horizontal axis depicts time and vertical axis represents subsampling factor. Reconstructions of both amplitude and phase using all pixels on the detector are shown at top, while reconstructions from subsampled pixel array data, using a factor of 4 and 9, are in middle and bottom, respectively. Consecutive frames show Peranema motion from left to right. Frame rate: first row – 4.4FPS, second row – 13.6FPS, third row – 24.8FPS. Scale bar is 22 µm. See Visualization 1 (520.4KB, MP4) , Visualization 2 (311.6KB, MP4) and Visualization 3 (222.3KB, MP4) for the full videos.

