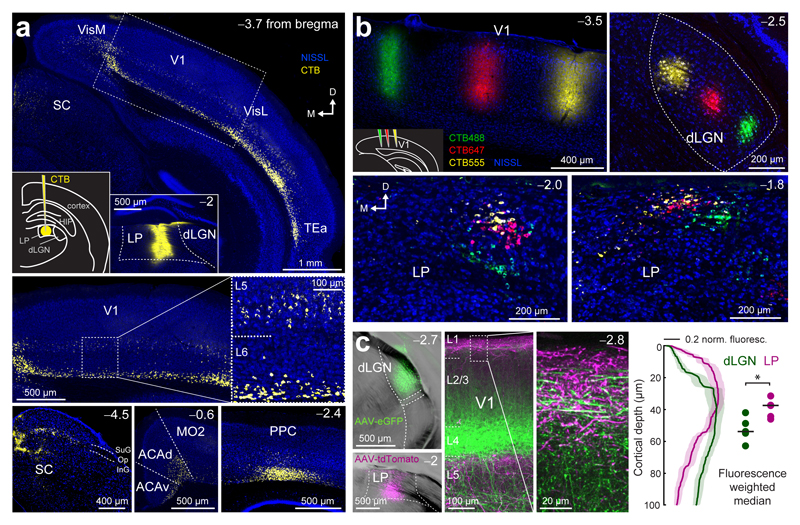
Figure 1. Connectivity of the lateral posterior nucleus (LP).
(a) Projections to LP. Retrograde tracer injection into LP (CTB; insets in top panel: left, schematic of the injection; right, injection site) and areas with substantial numbers of retrogradely labelled cell bodies. Top: V1, primary visual cortex; Hip, hippocampus; SC, superior colliculus; TEa, temporal association area; VisM, medial visual areas; VisL, lateral visual areas; Bottom: ACAd, dorsal anterior cingulate cortex; ACAv, ventral anterior cingulate cortex; MO2, secondary motor area; PPC, posterior parietal cortex; SC: superior colliculus, SuG, superficial gray layer; Op, optic layer; InG, intermediate gray layer. Arrows indicate the orientation of the coronal sections (similar for all images in this figure; M: medial; D: dorsal). (b) Organization of thalamic neurons projecting to V1 in coronal slices. Top, left panel: three retrograde tracer injections in V1 (see inset in bottom left corner; CTB488, CTB647 and CTB555) at different retinotopic locations. Retrogradely labelled neurons in dLGN (top, right panel) and in LP at two positions along the anterior-posterior axis (bottom panels). (c) Projections from LP and dLGN. Double injection of AAV2.1-Ef1a-eGFP into dLGN and AAV2.1-Ef1a-tdTomato into LP (left panels) and pattern of dLGN (green) and LP (magenta) axons in V1 (middle panels with an enlarged inset of layer 1). Right panel: normalized fluorescence intensity of LP (magenta) and dLGN axons (green) at different cortical depths in layer 1. Shaded areas denote s.e.m. Dots: weighted median of maximum fluorescence for individual brain slices. Black lines show the median, P = 0.03, Wilcoxon rank-sum test, n = 5 slices, 2 mice. Observations in a and b were reproduced in 11 and 3 mice, respectively.

