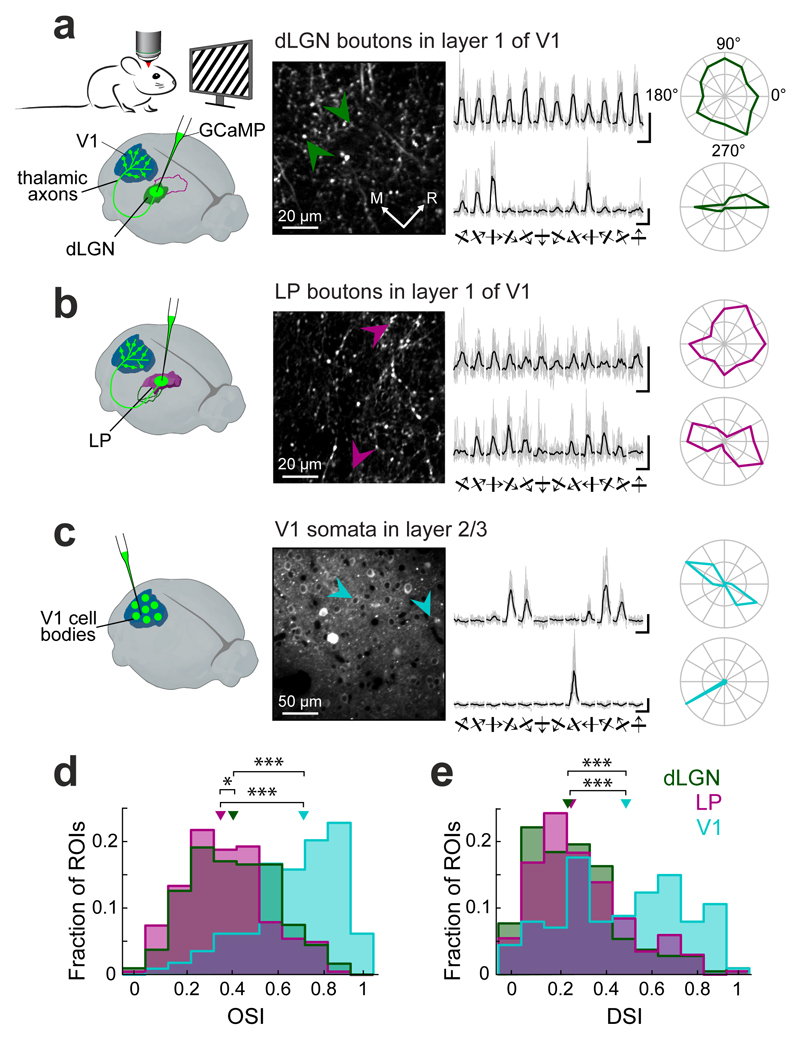
Figure 2. Orientation and direction selectivity of thalamic input to V1.
(a) Left, experimental schematic. Imaging responses of thalamo-cortical projections in V1 to drifting square-wave gratings using two-photon microscopy in anaesthetized mice expressing the calcium indicator GCaMP6 in dLGN. Middle, two-photon image of dLGN axons and putative axonal boutons in L1 of V1. Right, example fluorescence traces in response to 12 randomly interleaved grating directions (grey: eight individual repetitions re-ordered according to grating direction, black: average) and polar plots from two dLGN boutons (indicated by arrows; top bouton, OSI = 0.21, DSI = 0.13; bottom bouton: 0.91, 0.2). (b) Example responses of thalamo-cortical axonal boutons in L1 of V1 after GCaMP6 expression in the LP. Same layout as in a. (top bouton, OSI = 0.29, DSI = 0.38; bottom bouton: 0.81, 0.09) (c) Example responses of V1 layer 2/3 neurons. Same layout as in a. (top neuron, OSI = 0.95, DSI = 0.09; bottom neuron: 0.93, 0.91). (d,e) Distribution of orientation selectivity indices (OSIs, d) and direction selectivity indices (DSIs, e) of visually-responsive dLGN boutons, LP boutons and V1 cell bodies. Triangles indicate medians. *, p < 0.05; ***, p < 10−8, Wilcoxon rank-sum test. dLGN: n = 429 boutons, 6 mice, LP: n = 202 boutons, 6 mice, V1: n = 114 cells, 4 mice. All scale bars, 2 ΔF/F, 2 s.

