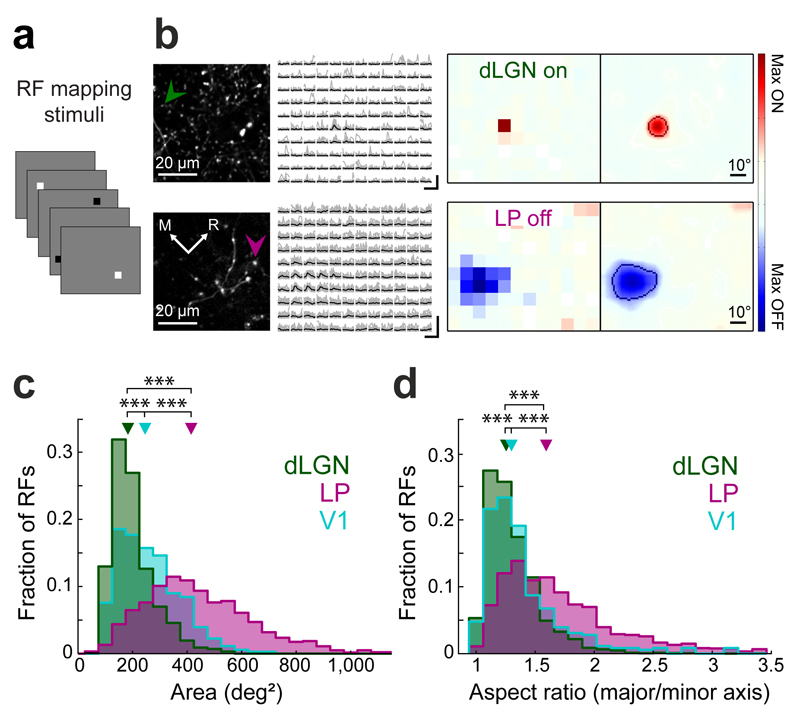
Figure 3. Spatial receptive field properties of thalamic input to V1.
(a) Schematic of receptive field mapping stimuli: black and white squares (8 deg x 8 deg) on a gray background. (b) Responses of an ON-selective dLGN bouton to white squares (top) and an OFF-selective LP bouton to black squares (bottom) at different positions. Left, two-photon image of dLGN (top) and LP (bottom) projections in L1 of V1. Middle left, example fluorescence traces of a single bouton (indicated by arrows; individual traces in gray, averages in black) ordered according to stimulus position. Scale bars, 400% ΔF/F, 2 s. Middle right, receptive fields of the boutons. Far right, smoothed receptive fields. Line indicates receptive field outline (see Methods). (c,d) Distributions of spatial receptive field size (c), and the ratio of major to minor axis length of receptive fields (d) of dLGN and LP boutons and V1 layer 2/3 cell bodies. Triangles indicate medians. ***, P < 10−10, Wilcoxon rank-sum test. dLGN: n = 2317 receptive fields, 7 mice, LP: 1825 receptive fields, 13 mice, V1: 356 receptive fields, 4 mice.

