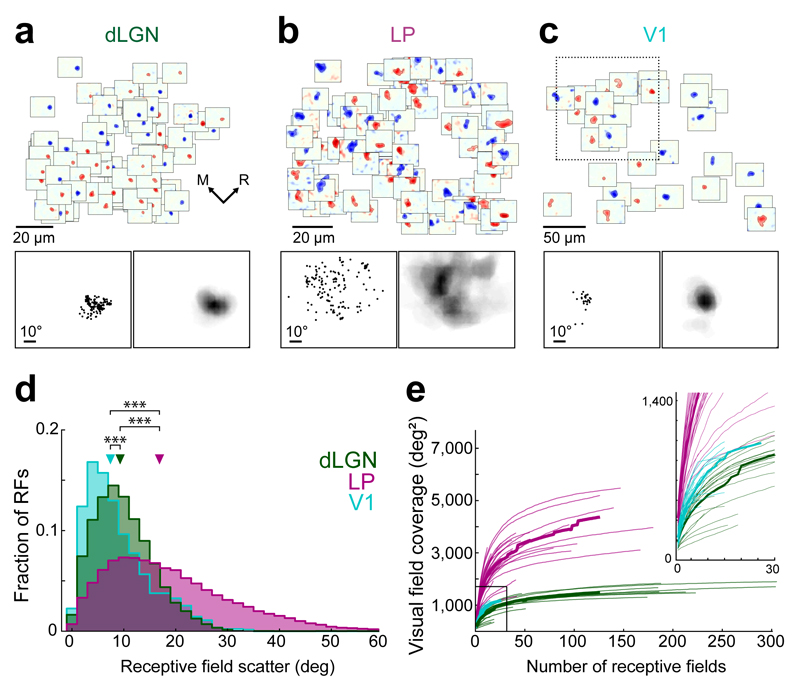
Figure 4. Scatter and visual field coverage of thalamic spatial receptive fields.
(a) Example population of all dLGN receptive fields from one 120 µm by 120 µm region in L1 of V1. Top, receptive field subdomains of individual boutons plotted at the boutons’ cortical x-y position within the imaged region. Bottom left, positions of subdomain centroids in visual space from the dLGN receptive fields above. Bottom right, sum of all dLGN receptive fields above, illustrating their visual field coverage. (b) All LP receptive field subdomains from an example region. Same layout as a. (c) Population of V1 layer 2/3 neuron receptive field subdomains from an example 250 µm by 250 µm region. Same layout as a except that the bottom panels refer to a 120 µm by 120 µm subset of the imaged region above (indicated by dashed-line square). (d) Distribution of receptive field scatter, determined by the distances between the centroids of pairs of receptive fields. For neurons or boutons with both ON and OFF subdomains, these were included separately (see Methods). dLGN: n = 273353, LP: n = 87804, V1: n = 1380 pairs of receptive fields. Triangles indicate medians. ***, p < 10−10, Wilcoxon rank-sum test. (e) Cumulative area covered by the population receptive field as a function of the number of individual receptive fields. Thin lines indicate individual imaged regions, thick lines indicate medians. dLGN: n = 20 regions, 7 mice, LP: n = 33 regions, 13 mice, V1: n = 8 regions (subdivided into 32), 4 mice.

