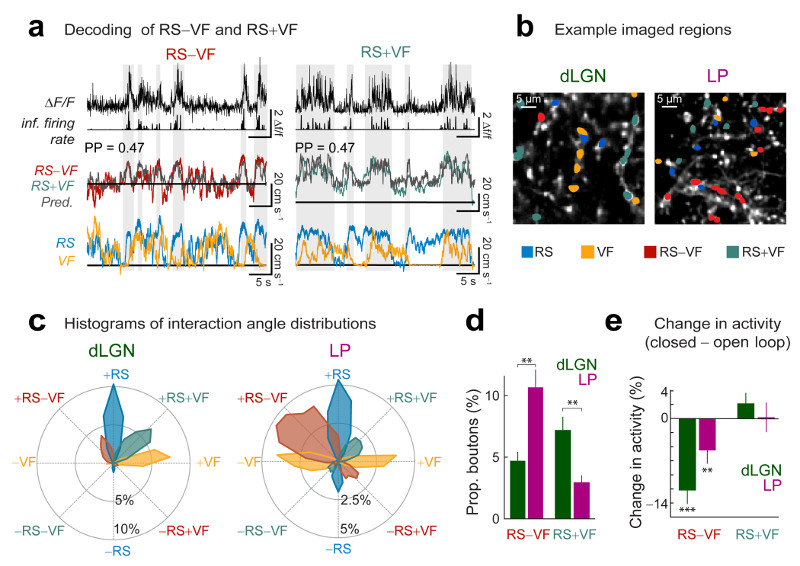
Figure 7. Visuo-motor discrepancy signals are enriched in LP.
(a) Calcium traces and inferred firing rate (top) of two example boutons aligned to the difference between running speed and visual flow speed (RS–VF, left) or the equal sum of RS and VF (RS+VF, right), over-plotted with model predictions for these traces (gray) obtained with a random forest decoder trained on inferred spike rates from the example boutons above. PP: prediction power. Bottom: aligned running speed and visual flow speed traces. Gray shaded regions reflect periods of elevated RS−VF or RS+VF (horizontal black lines indicate zero). (b) Example imaged regions. Boutons with highest PP for RS, VF, RS–VF or RS+VF are indicated by different colors (if PP > 0.16). (c) Circular histogram with distributions of interaction angles θ for different groups of LP and dLGN boutons. Similar to Fig.6e, but boutons were grouped according to which variable they predicted best (groups with highest PP for RS, VF, RS+VF or RS−VF are indicated by different colors). (d) Proportions of dLGN and LP boutons with highest PP for RS−VF or RS+VF (if PP > 0.16) out of all boutons. Wilcoxon rank-sum test. dLGN: n = 18 regions, 8 mice, LP: n = 31 regions, 10 mice. (e) Average change in activity in the closed-loop condition relative to the open-loop condition for boutons most informative about RS–VF or RS+VF in the open-loop condition (thresholded average ΔF/F, see Methods; Wilcoxon signed-rank test; dLGN: RS+VF, 334 boutons, RS–VF, 206 boutons, n = 10 session pairs, 7 mice, LP: RS+VF, 99 boutons, RS–VF, 276 boutons, n = 13 session pairs, 8 mice.). **, P<0.01; ***, P<10−10.

