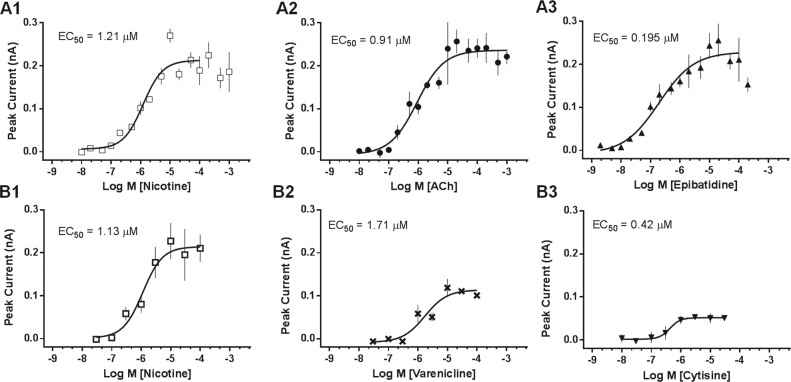
Figure 2.
Agonist assay validation. (A) Concentration-response curves (16-point) were obtained for three full agonists in two independent experiments on different days. Compounds were administered at the indicated concentrations, and responses were recorded simultaneously. (B) Concentration-response curves (eight-point) for partial agonists, varenicline and cytisine. Data points represent mean peak current ± SEM (two to four replicate wells/concentration). Curves were fitted to the data by a one-site model.

