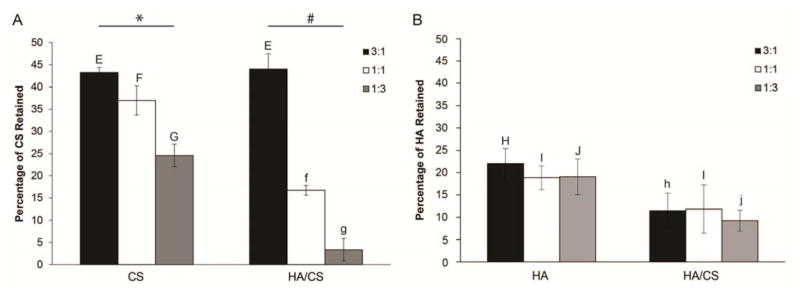
Figure 3.
The percentage of (A) CS and (B) HA retained in the fibrils. Gels were created using varying ratios of collagen type I to II (3:1, 1:1, and 1:3) with either CS, HA, or both CS and HA added into the gels. ANOVA and Tukey’s honestly significant difference post hoc tests were performed. The * indicates significant differences (p < 0.05) between the three different hydrogel blends when CS is added. The # indicates significant differences (p < 0.05) between the three different hydrogel blends when HA and CS are added. EE indicates there is no statistical difference (p > 0.05) between the 3:1 gels. Ff and Gg indicate that there were statistical differences (p < 0.05) between the 1:1 and 1:3 gels, respectively. There is no significant difference (p > 0.05) between the three different hydrogel blends when either HA or HA and CS were added. Hh and Jj indicate that there were statistical differences (p < 0.05) between the 3:1 and 1:3 gels, respectively. II indicates there is no statistical difference (p > 0.05) between the 1:1 gels. Data (n = 3) are represented as the mean ± the standard deviation.

