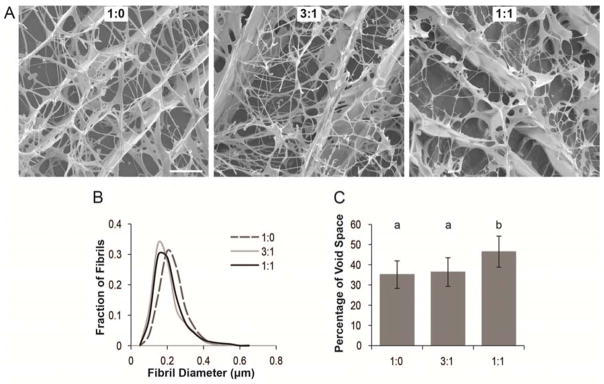
Figure 4.
Collagen networks for different ratio blends. (A) Representative cryoSEM images of different ratio blends of collagen type I to collagen type II show the collagen fibril network within the gels. Scale bar represents 5μm. (B) Distribution of collagen fibril diameters in the gels at different ratio blends. (C) Percentage of void space for the gels based on cryoSEM images obtained at 10,000x magnification. ANOVA and Tukey’s post hoc tests were performed on the percentage of void space data by using nested factorial models. The different letters indicate groups with a significant difference (p < 0.05) in the percentage of void space in the gels. Data (n ≥ 15) for void space percentage are represented as the mean ± the standard deviation.

