
Extended Data Figure 2. Gene targeting and generation of EPRSA/A and EPRSD/D knock-in mice, and their body weight phenotypes.
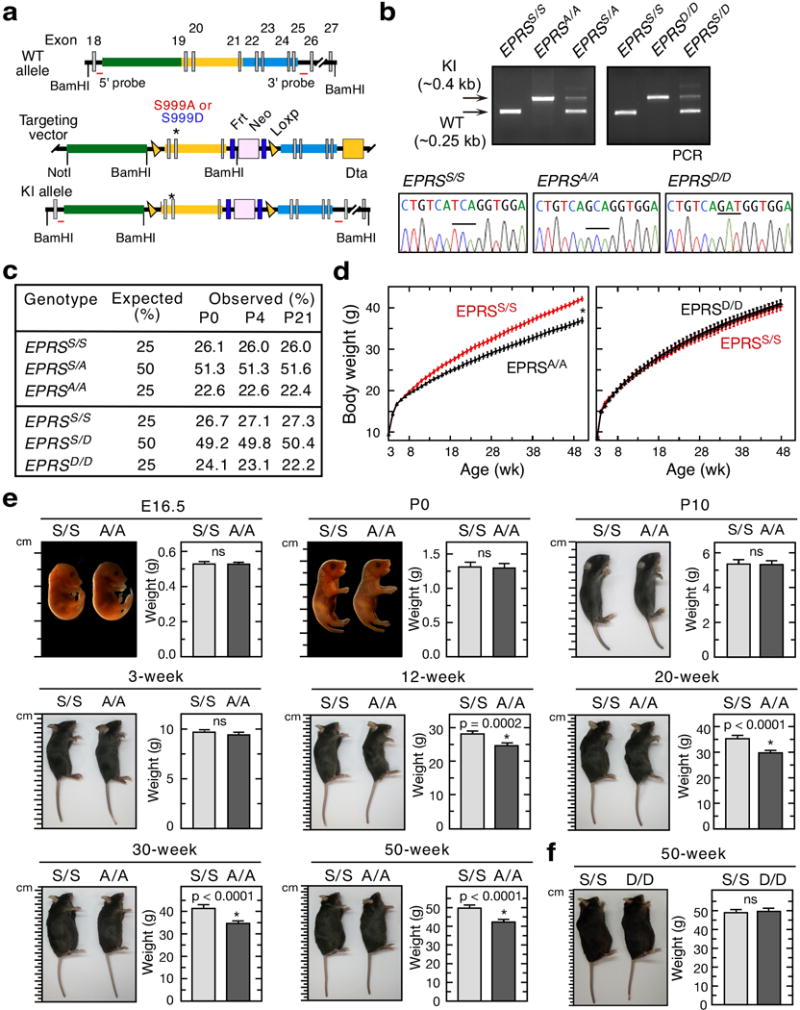
a, Knock-in mice bearing Ser999-to-Ala and -Asp mutations were generated by homologous recombination. b, Validation of wild-type (EPRSS/S) and EPRS knock-in mice by PCR genotyping (top) and sequence analysis (bottom). c, Genotype analysis of littermates. Total of 1410 and 644 progeny from interbreeding EPRSS/A and EPRSS/D mice, respectively, were used at postnatal days P0, P4, and P21. d, Growth curves of EPRSA/A (mean ± SEM, n = 10/group; P < 0.0001, 2-way ANOVA) and EPRSD/D (n = 10/group) female mice. e, Representative images (left) and weights (right) of wild-type (EPRSS/S; S/S) and EPRSA/A (A/A) mice on embryonic day E16.5 and post-embryonic development stages. Data shown are mean ± SEM; n = 11 for E16.5 embryos, n = 10 for P0 and P10 mice, and n = 14 for 3, 12, 20, 30, and 50-week mice. f, Representative images (left) and weights (right) of 50-week S/S and EPRSD/D (D/D) mice (mean ± SEM; n = 10/group).