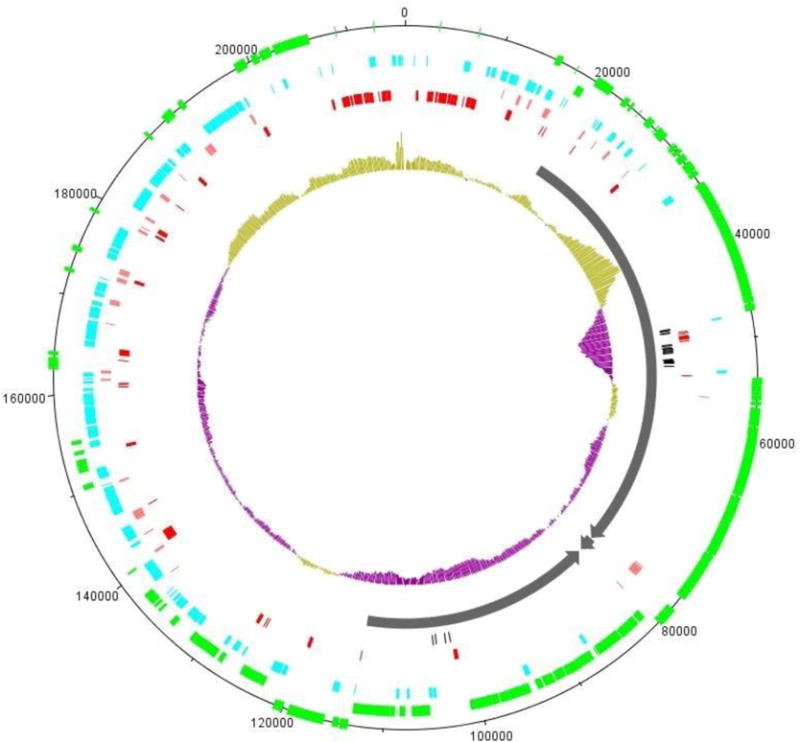
Fig. 3.

DNA plot image of the CbK genome gene categories. Gene positions correspond to the CbK genome. Starting at the outer perimeter of the circle, the green blocks represent the genes found in all 12 genomes, the light blue are conserved throughout the 11 CbK-like genomes. The pink blocks are conserved in the 10 CbK-like genomes excluding Rogue. Dark red blocks represent the indels in the CbK genome. Black blocks are the tRNA locations. The dark grey arrows represent the location of the Genomic modules, the structural module, lysis module, and DNA replication module respectively, clockwise from the top of the circle. The center plot is the GC content of the CbK genome with gold bars marking regions of above average %GC and purple bars marking the regions with below average %GC.
