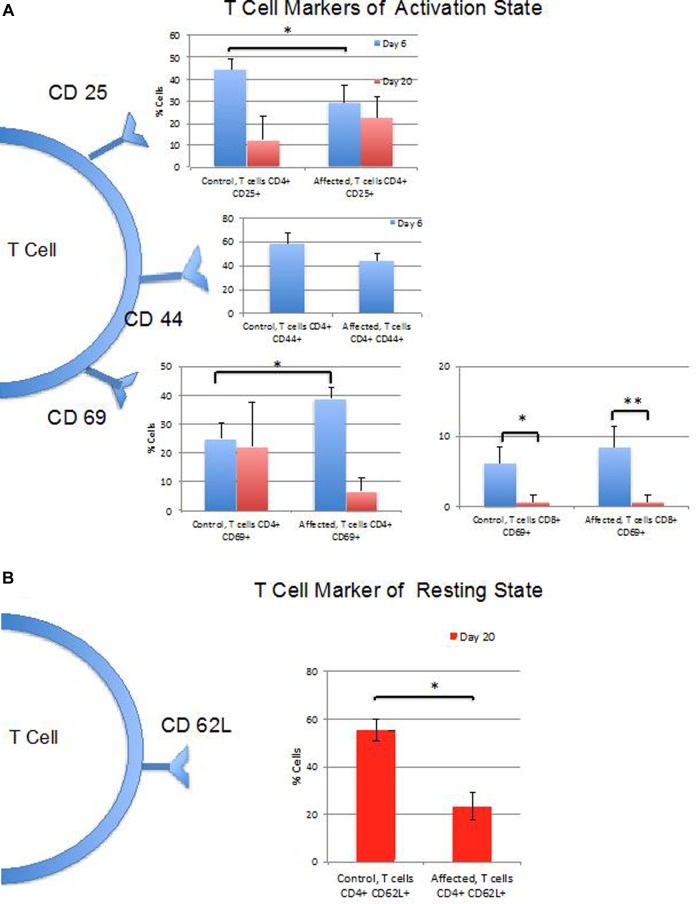
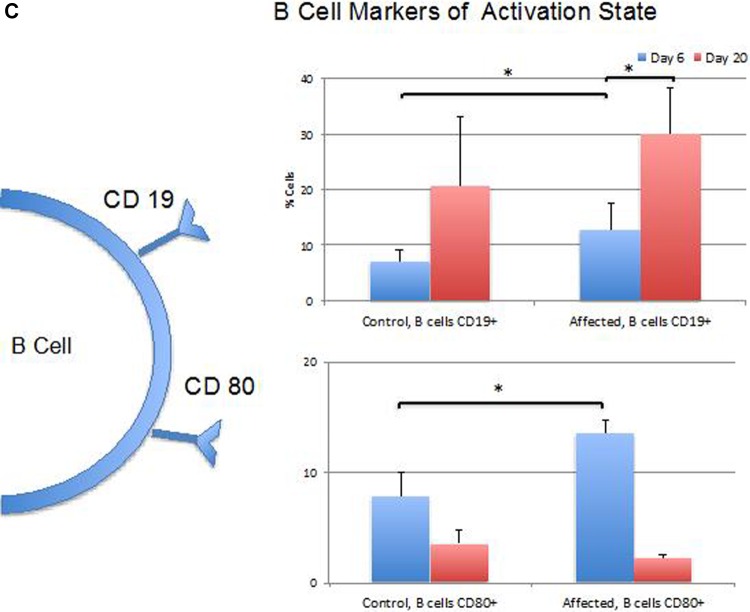
Figure 3.
Summary of cell surface marker expression at 6 and 20 days. A, Percentages of T-cell populations expressing markers of activation including CD25 (only CD4+ cells tested), CD44 (only CD4+ cells tested at 6 days), and CD69 (both CD4+ and CD8+ cells populations tested). B, Percentages of T-cell populations expressing CD62 L marker of resting state (only CD4+ cells tested at 20 days). C, Percentage of CD4+ B-cell populations expressing markers of activation including CD19 and CD80. (*P < .05; **P < .01).


