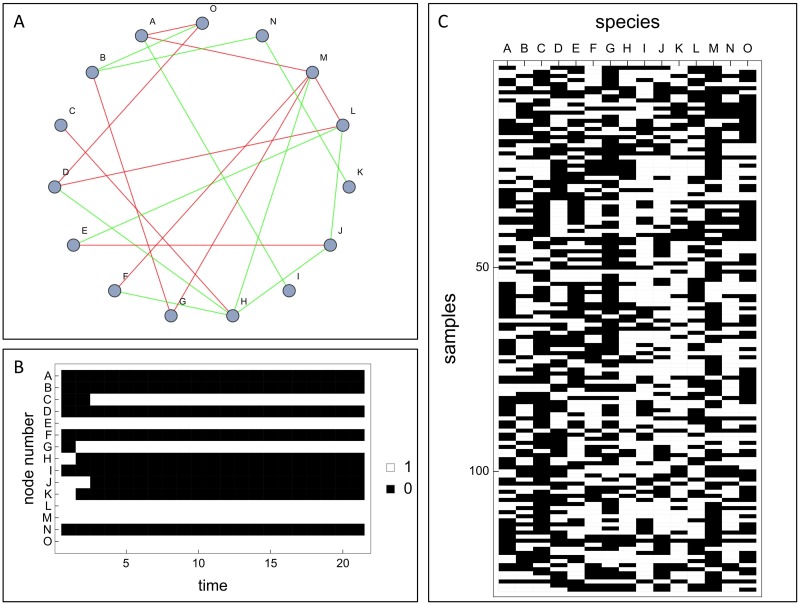
Fig 1.
(A) Example of a species interaction network (N = 15, M+ = M− = 10) used to generate synthetic data of microbial abundances. The positive (negative) links are displayed in green (red) colour or respectively light gray (dark grey). (B) Time course obtained from recursively updating a random abundance pattern for the species interaction network from (A) according to the update rule, Eq (3). (C) Data matrix Aij showing all (NA = 129) numerically observed attractors for the network from (A).

