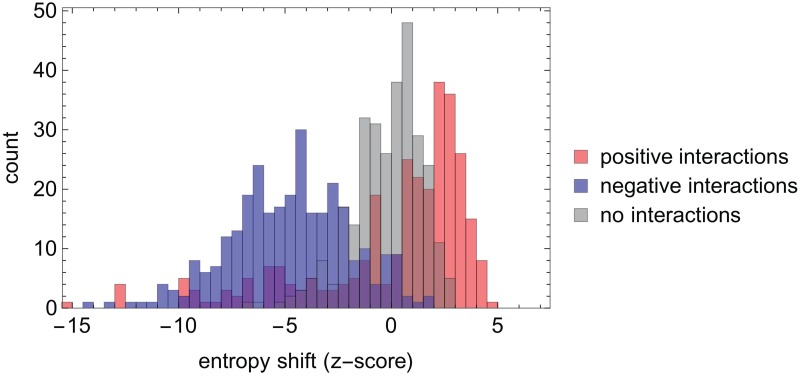
Fig 2. Histogram of z-scores of entropy shifts obtained with the ESABO method (Boolean AND) applied to simulated binary abundance patterns from 20 species interaction networks consisting of 15 nodes and 15 positive and negative interactions, respectively.
Blue: negative interactions, red: positive interactions, gray: random sample of absent links. (Note that ‘mixed colors’ appear, when histograms overlap.)

