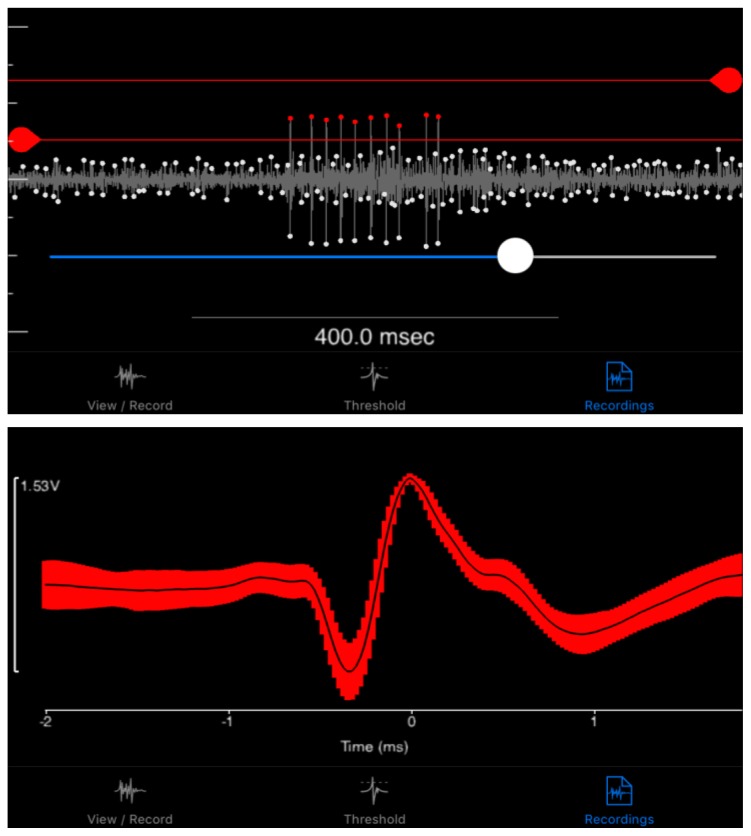
Figure 4.
Spike sorting in the SpikeRecorder iPad app. SpikeRecorder provides both the looming visual stimuli and recording and analysis of DCMD activity. DCMD spikes can be sorted from noise after recording by providing minimum and maximum spike threshold values. These values can be applied to all recordings made within a single grasshopper’s experimental session. (Top) The app’s output of the DCMD recordings during a looming experiment (object size S = 6cm, velocity v = −2m/s) with a minimum spike amplitude of approximately 0.30mV, maximum of 0.65mV. Red dots are spikes recorded within the thresholds. (Bottom) The app can also analyze data after spike sorting. Shown here is an example graph showing the average waveform of DCMD activity over time, within 1 standard deviation.

