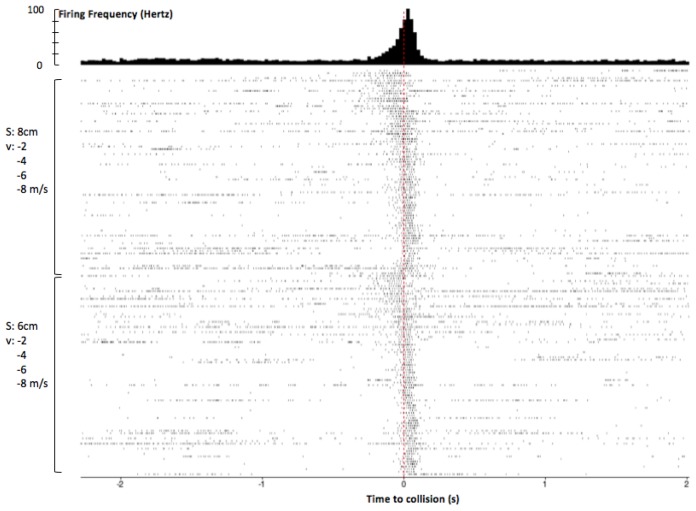
Figure 5.
Mobile app analysis of DCMD response to approaching objects, with additional annotations. After spike sorting, the SpikeRecorder app produces a perievent time histogram (PETH) and raster plot to show DCMD firing activity 2s before and after collision. Peak firing was 92Hz around collision. Rasters are ordered top to bottom by large to small S, then slow to fast v. Similar patterns of DCMD activity are seen for dots 6cm and 8cm in size, with peak firing frequency before collision when the dots are approaching at slower velocities (−2 and −4m/s) compared to those at faster velocities (−6 and −8m/s). Session: G17-071416-01 (see Supplementary Information). Parameters: d: 10cm; S: 6, 8cm; v: −2, −4, −6, −8m/s; trials per pair of S and v: 30; ITI: 45s. Collision at 0s.

