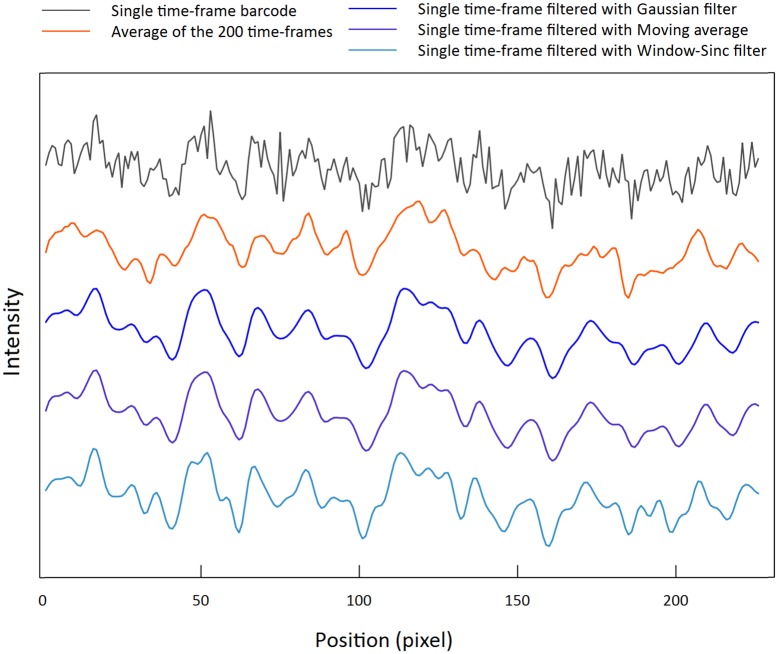
Fig 2. Example barcode filtered using our noise-reducing filtering method.
(grey) A noisy single time-frame (snap-shot) barcode taken with 0.1s exposure time. (orange) The time average of the aligned kymograph. Such time-averages are used as reference (“true” barcode) throughout this study and used to judge the quality of the filtering process. (blue barcodes) From top to bottom Gaussian, Moving average and Sinc filter, respectively, is applied recursively to the single-time frame barcode (grey) until all peaks in the filtered barcode have a FWHM of at least that of the FWHM of the PSF of the system. Notice the visual similarity of the filtered barcodes to the time-averaged barcode. The Pearson correlation coefficient between the time average of the aligned kymograph and the barcode before and after the the filtering changes from 0.6 without the filtering, to 0.8 after filtering. The original raw kymograph consists of 200 single time-frame shots (exposure time 0.1s) from plasmid pEC005B.

