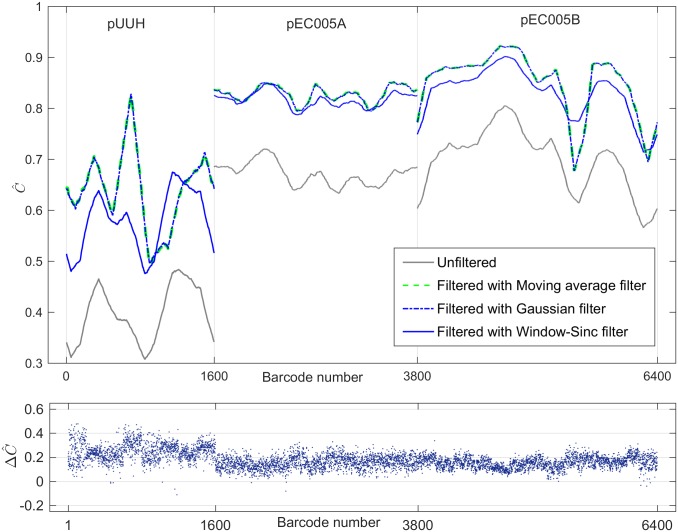
Fig 3. Change in the Pearson correlation coefficient between each single time-frame barcode and its aligned kymograph time average after application of the low-pass filter.
The first 1600 barcodes originate from the pUUH plasmid, barcodes 1601-3800 are from plasmids pEC005A, and barcodes number 3801-6400 from plasmids (pEC005B). In grey is shown the correlation coefficients for the case without filtering, and in blue/green the correlation after filtering. The four lines in the top plot are smoothed for visualization purposes and are moving averages of the result over the 300 nearest neighbor barcodes (each of the three plasmid types treated separately). The bottom panel shows the change , for all 6400 single time-frames for the case of Gaussian filter. Here, is the correlation coefficient between the filtered single time-frame (fst) barcode and the time averaged (ta) barcode, and is the correlation coefficient between the unfiltered (noisy) single time frame barcode and the kymograph time average. Notice the rather dramatic improvement in correlation with the time-averaged (“true”) barcodes after filtering. In all of the cases the filter parameter used was the (known) FWHM of the PSF of the system ωpsf. Here, ωpsf = 4.5 pixels.

