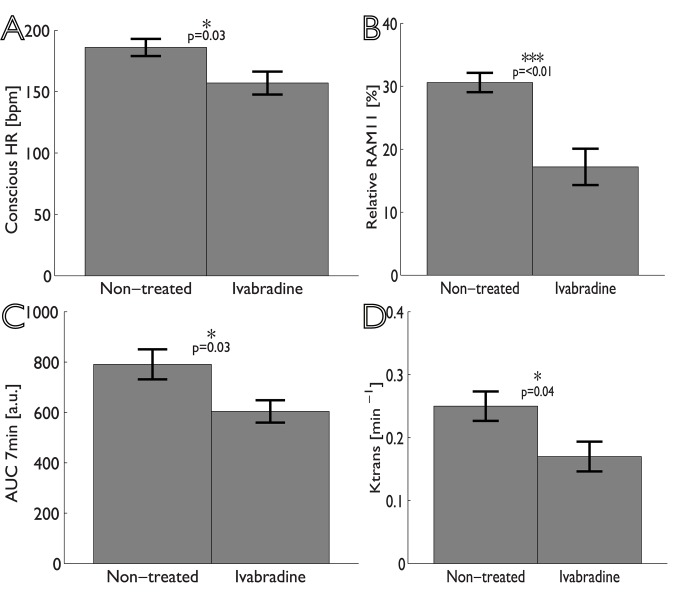
Fig 2. Bar graphs showing the differences between non-treated and Ivabradine-treated animals (mean ± standard error).
Panel A shows the conscious heart rate; panel B relative RAM11 positive area in histological sections; panel C and D show the area-under-the-curve (AUC) and Ktrans determined from analysis of DCE-MR images.

