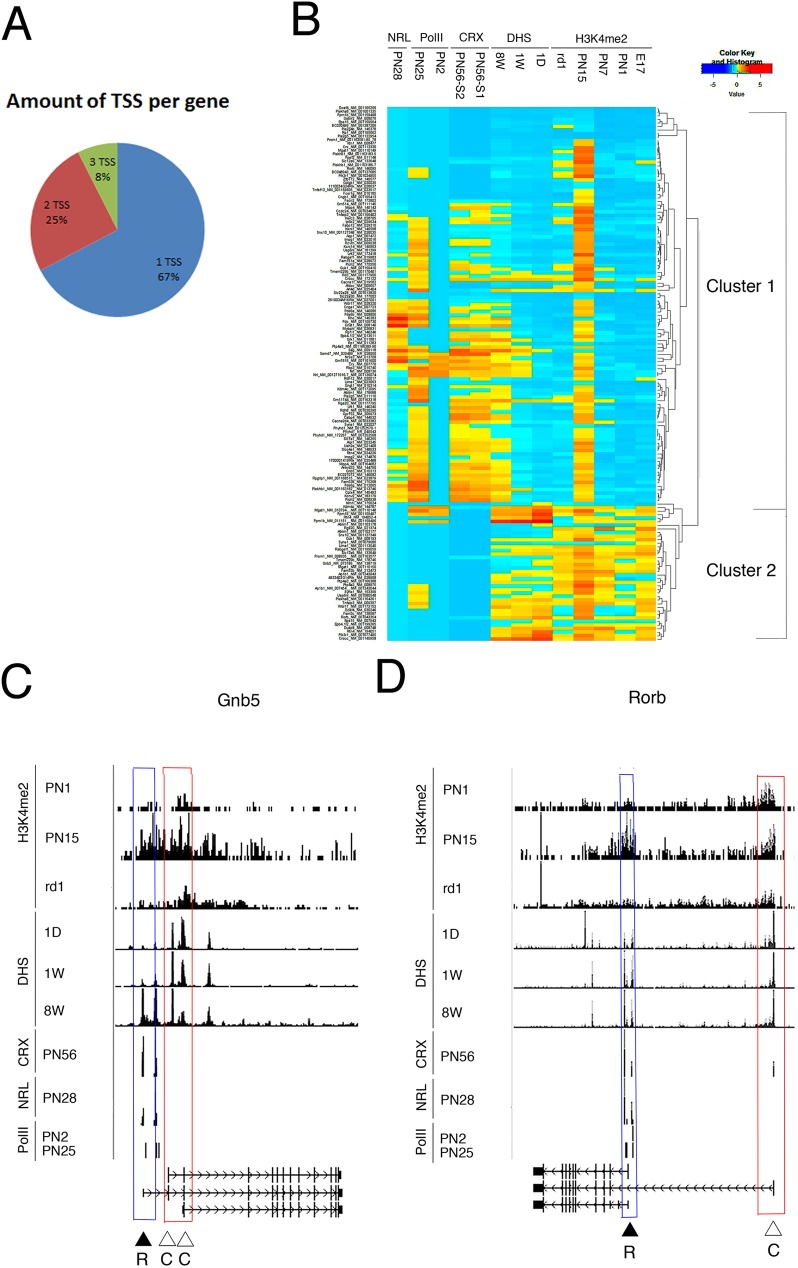
Fig 1. Epigenetic signature predicts employment of ATSS of ubiquitous gene in tissue-specific manner.
A. Pie chart presentation for number of TSS for different groups of rod-specific genes. B. All TSS for rod-specific genes were clustered based on chromatin signature around TSS+/-1000bp for following features: developmental changes in H3K4me2 occupancy (E17, PN1, PN7, PN15 and RD1 PN30), CRX-binding (PN56), NRL-binding (PN28), developmental changes in DHS (1D, 1W, 8W), developmental changes in PolII (PN2, PN25) as clustering criteria (see methods for details). C, D. Combined genome-wide tracks of chromatin features, as in B for Gnb5 and Rorb genes. Common TSS is depicted as C/ red box, rod TSS–as R/ blue box.

