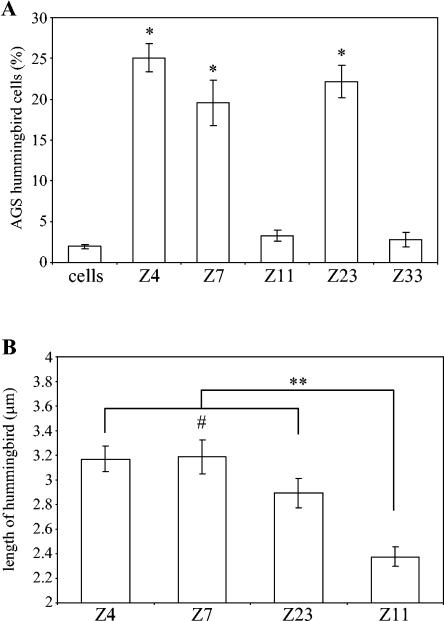
FIG. 5.
AGS cell hummingbird phenotype formation is reduced by CagA with two variable-region TPMs. AGS cells were cocultured with H. pylori strains Z4, Z7, and Z23 (three variable-region EPIYA motifs) and with strains Z11 and Z33 (two variable-region EPIYA motifs) for 1 day before cells were visualized by microscopy. (A) Percentages of AGS cells displaying the hummingbird phenotype in randomly chosen microscopic fields. *, P < 0.001 (Z4, Z7, or Z23, compared to Z11, Z33, or cells alone). (B) Average lengths of protrusions characteristic of hummingbird phenotype of at least 100 randomly chosen hummingbird phenotype AGS cells cocultured with each strain. **, P < 0.0001; #, P > 0.05. Errors bars represent standard errors of the mean.

