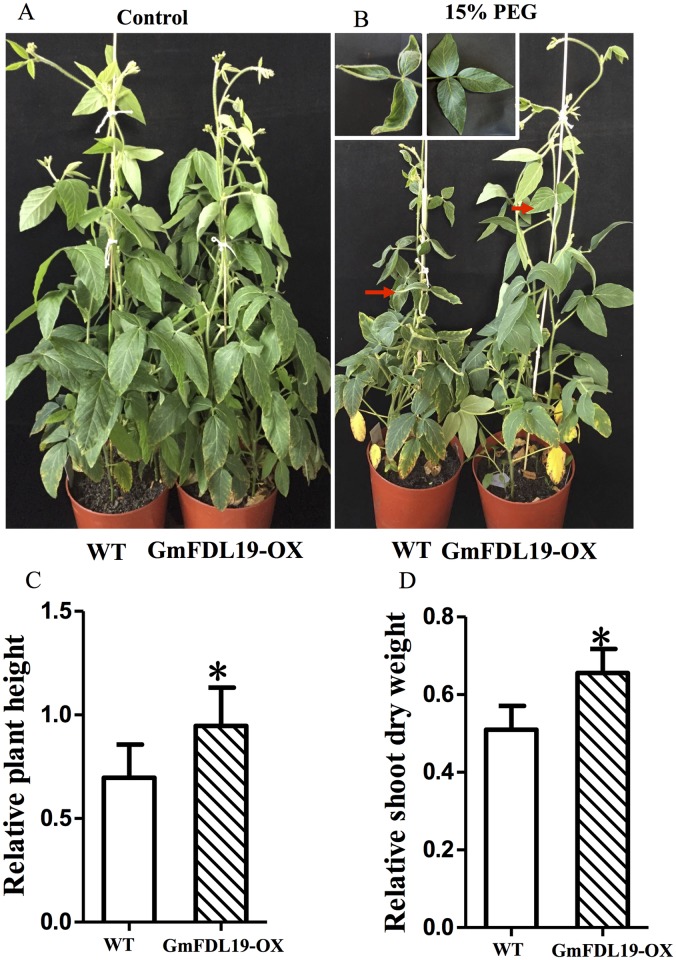
Fig 2. Effects of PEG on soybean that overexpress GmFDL19.
Photographs were taken at the end of PEG treatment of normal condition (A) and PEG treatment (B). The relative plant height (C) and relative dry weight of shoots (D) were calculated as the ratio of the values under salt stress conditions to the value under control condition. P-values were calculated using Student’s t-test. *P < 0.05 compared with WT.

