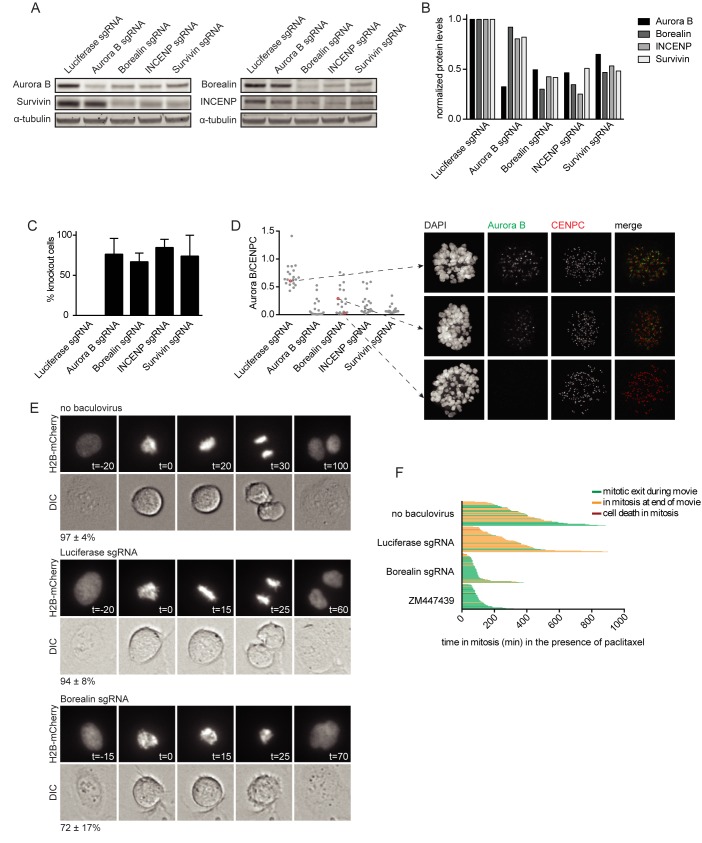
Fig 2. CRISPR/Cas9 baculovirus mediated knockout of CPC subunits in U-2 OS cells.
A) Western blot of CPC members from mitotic U-2 OS cells treated with CRISPR/Cas9 baculoviruses (MOI: 25). α-tubulin was used as a loading control. B) Quantification of the Western blot shown in A. Protein levels were normalized over α-tubulin. C) Immunofluorescence images of mitotic U-2 OS cells treated with CRISPR/Cas9 baculoviruses (MOI: 25) were scored for loss of centromeric Aurora B. Bars represent the mean ± the standard deviation (SD) of 3 independent experiments. 100 cells were analyzed per experiment. D) Quantification of centromeric Aurora B levels in immunofluorescence images of mitotic U-2 OS cells treated with CRISPR/Cas9 baculoviruses (MOI: 25). Aurora B levels were normalized over CENPC. Thirty cells were analyzed per condition. Immunofluorescence images of the indicated cells are shown. E) Mitotic progression of H2B-mCherry U-2 OS cells that were transduced with the indicated CRISPR/Cas9 baculovirus (MOI: 25) and control cells. The timing of each frame is indicated in minutes, with the first frame in prometaphase set to t = 0. The average percentage of cells displaying the depicted phenotype and the SD are indicated. The numbers represent the average of 2 experiments and at least 10 cells were analyzed per condition for each experiment. F) Time in mitosis for U-2 OS cells that were transduced with the indicated CRISPR/Cas9 baculovirus (MOI: 25) in the presence of 1 μM paclitaxel. Cells treated with 2 μM ZM447439 were used as a positive control for the override of a paclitaxel-induced mitotic delay. Each bar represents a single cell. At least 48 cells were analyzed for each condition. The color of the bar indicates cell fate as depicted in the figure legend.

