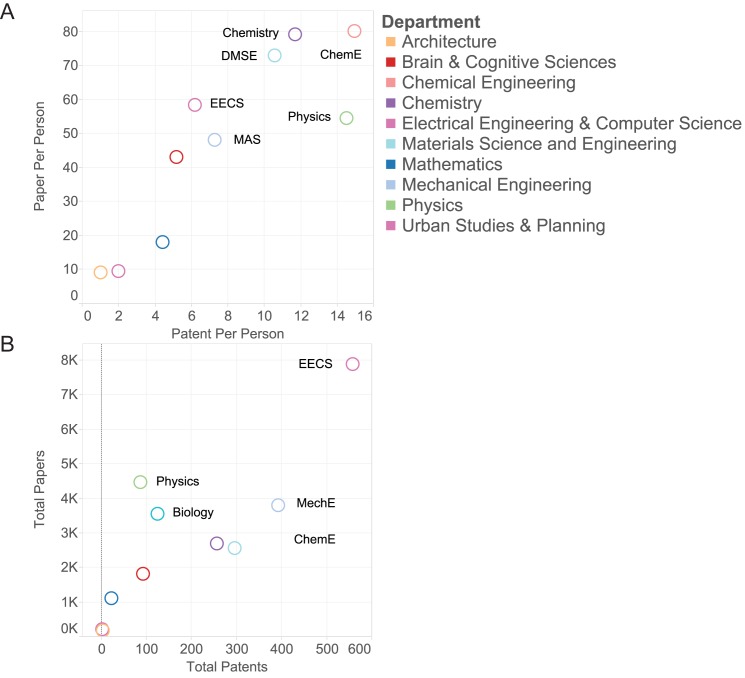
Fig 1. The ratio of paper vs patent output, aggregated to the department and individual levels.
Each circle represents a department, and output per department / per person determines position along the axes. Many departments tend to have a bias toward one output type, but a notable group produces high relative numbers of both papers and patents. Here EECS, MechE and ChemE stand for Electrical Engineering and Computer Science, Mechanical Engineering and Chemical Engineering respectively.

