
Fig 4. Glucosinolate and tryptophan-derived metabolite levels in med18, med25, and WT.
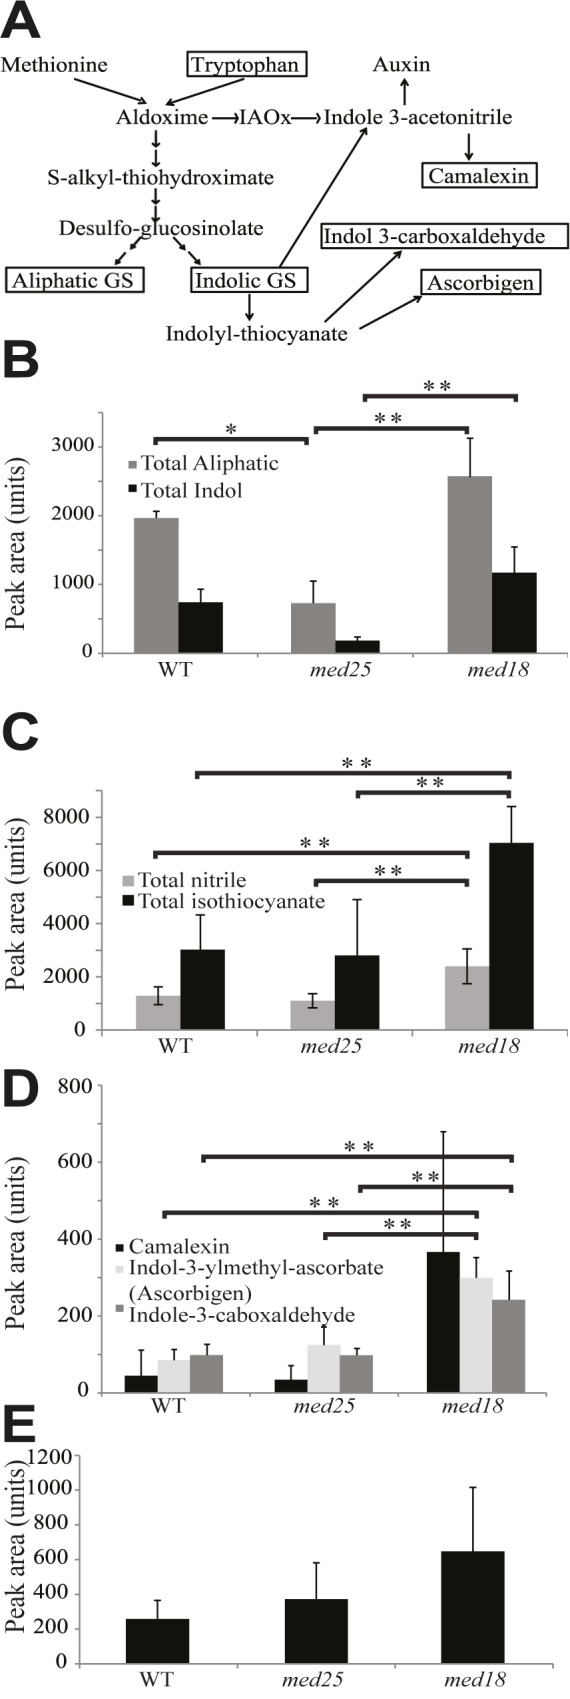
(A) Overview of the glucosinolate metabolism and phytoalexin synthesis pathways. (B) Total levels of aliphatic (grey bars) and total indole glucosinolates (black bars). (C) Levels of aliphatic glucosinolate breakdown metabolites. Total nitrile (grey bars), total isothiocyanate (black bars). (D) Levels of indole glucosinolates breakdown metabolites. (E) Levels of tryptophan. Standard deviations were calculated from six biological repeats. Significance analysis of differences between WT and mutant was performed using an analysis of variance (ANOVA) with Tukey's HSD applied as a posthoc test (*, P ≤ 0.05; **, P ≤ 0.01).