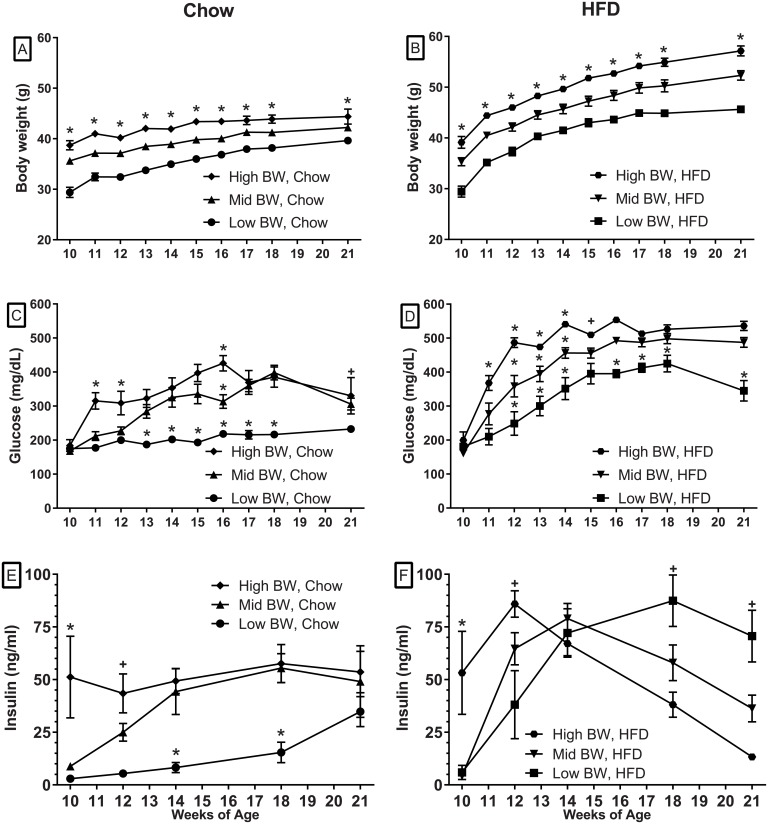
Fig 1. The effects of initial weight and diet on body weight, glucose and insulin levels.
The top figures illustrate Body weight gains of animals on the Chow diet (A) and HFD (B). The middle panels (C, D) demonstrate the effects of the two diets on glucose levels. Insulin levels in Chow (E) and HFD (F) groups are illustrated in bottom panels. The * (A, B) indicates that all weight groups are statistically different from each other at all of the time-points with each diet. Statistical differences from the other groups (C-F) are identified by * while the + sign identifies differences between the highest and lowest values (two-way ANOVA followed by Sidak’s multiple comparison test, * or + p < .05). Additional differences between diets in each weight category are summarized in the text.

