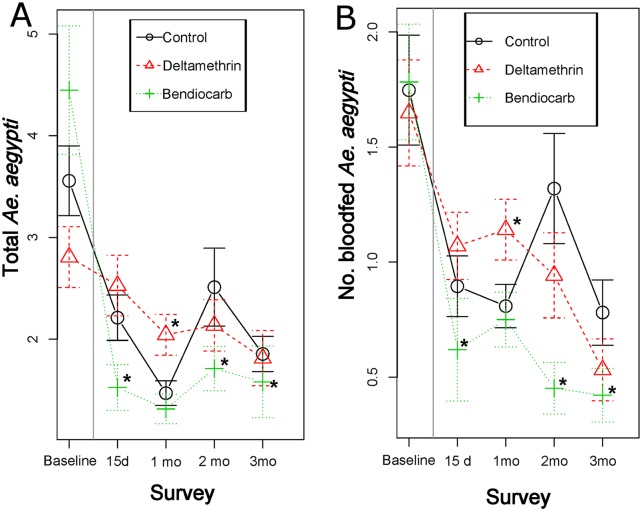
Fig 3. Average (±SE) number of Ae. aegypti collected per survey date and by treatment.
Panel (A) shows positivity for adult Ae. aegypti and panel (B) positivity for bloodfed female Ae. aegypti. Vertical gray line indicates the timing of the intervention. Asterisks (*) indicate statistically significant (P<0.05) difference between each treatment and the control, mixed-effects Poisson regression model (Table 2).

