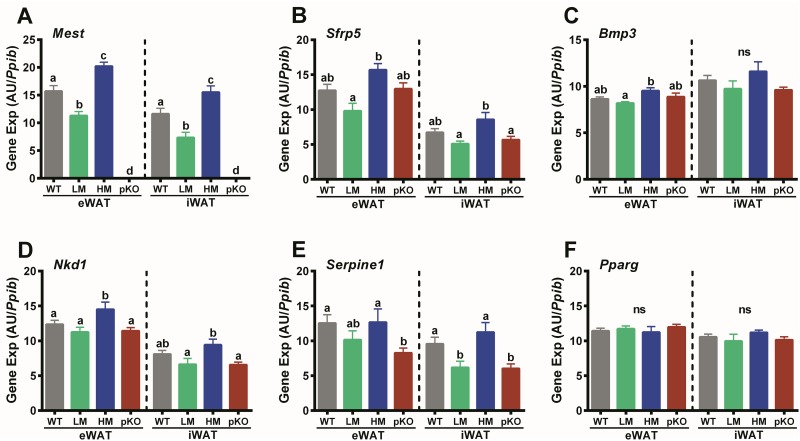
Fig 7. WAT gene expression in mice with inactivated Mest.
(A) Data shows expression of Mest, (B) Sfrp5, (C) Bmp3, (D) Nkd1, (E) Serpine1, and (F) Pparg in epididymal (eWAT) and inguinal (iWAT) white adipose tissue of wildtype (WT; n = 17) mice with a paternal inactivation of Mest (pKO; n = 10) and subgroups of WT mice with low (LM; n = 6) and high (HM; n = 6) WAT Mest expression after being fed a HFD from 8–16 weeks of age. Gene expression was determined via TaqMan qRT-PCR in total RNA from eWAT and iWAT and represented as arbitrary units (AU) normalized to cyclophilin b (Ppib). Gene expression is presented as the mean ± SEM and significance between groups was determined using two-tailed unpaired parametric t-tests. Datasets annotated with the same letter indicate no significant differences between groups.

