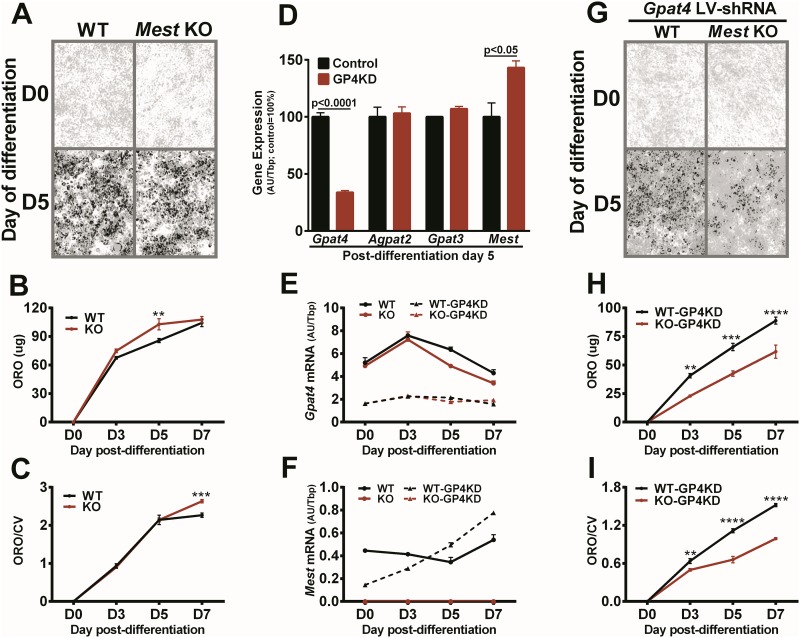
Fig 9. In vitro analysis of adipogenesis and effects of Gpat4 -knockdown on ear-derived mesenchymal progenitor cells from wildtype and Mest KO mice.
(A) Oil red O (ORO) staining of lipid is shown in representative 10X (gray-scale) microscopic images of ear-derived mesenchymal progenitor cells (EMSC) from WT and homozygous Mest knockout (KO) mice prior to (D0) and after 5 days (D5) of adipogenic differentiation. (B) Graph represents spectrophotometric measurements of eluted ORO (ug) during 7 days of adipogenic differentiation using 3–4 replicate cultures of EMSC from WT and Mest KO mice for each time point on the X-axis. (C) Data shows an additional independent experiment using 3–4 replicate cultures of EMSC from WT and Mest KO mice at each time point during adipogenic differentiation that were stained with ORO and counterstained with crystal violet (CV) to normalize for cell number. (D) Figure shows mRNA expression of Gpat4, Agpat2, Gpat3 and Mest measured by qRT-PCR in WT EMSC in the absence (Control; n = 3) or presence of lentiviral shRNA knockdown of Gpat4 (GP4KD; n = 3) at post-adipogenic differentiation day 5. Gene expression data is presented as arbitrary units normalized to Tbp (AU/Tbp). Significance in gene expression between control and GP4KD cells was determined using two-tailed unpaired parametric t-tests and p-values between groups are indicated. (E) and (F) show Gpat4 and Mest mRNA expression in duplicate samples for WT and Mest KO EMSC in the absence or presence of GP4KD during adipogenic differentiation from D0 to D7. (G) ORO staining of lipid is shown in representative 10X (gray-scale) microscopic images of WT and Mest KO EMSC in the presence of GP4KD prior to (D0) and after 5 days (D5) of adipogenic differentiation. (H) Spectrophotometric profiles of eluted ORO during 7 days of adipogenic differentiation are shown for 3–4 replicates of WT and Mest KO EMSC after GP4KD are shown for each time point on the X-axis. (I) Data shows an additional independent experiment using 3–4 replicate cultures of EMSC from WT and Mest KO mice after GP4KD at each time point during adipogenic differentiation that were stained with ORO and counterstained with CV to normalize for cell number. Significance at each time point of adipogenic differentiation (B, C, H and I) was determined by 2-way ANOVA and Sidak’s multiple comparisons test. Datasets with 2, 3 or 4 asterisks indicate p-values of <0.01, <0.001 and <0.0001 respectively.

