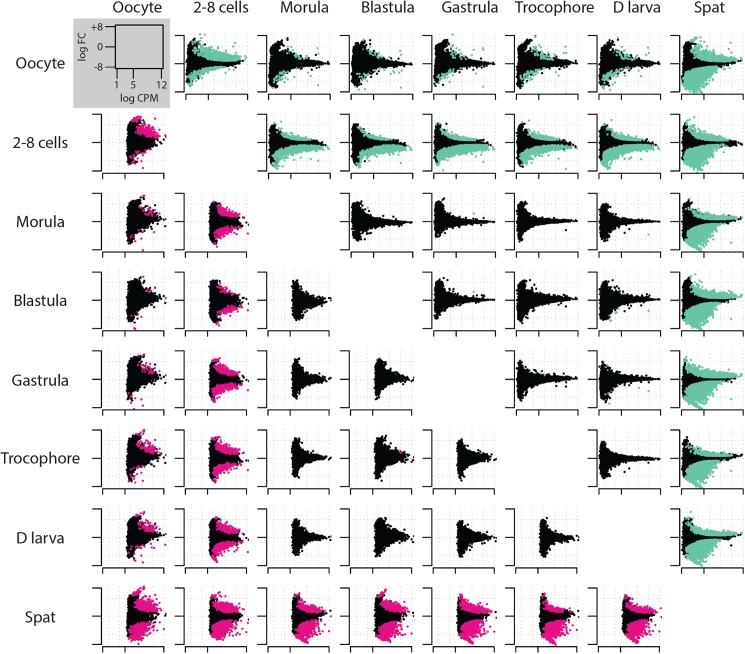
Fig 2. Oyster developmental methylomes exhibit feature- and stage-dependent landscapes highlighting cleavage and metamorphosis.
Pairwise comparisons of the methylation of coding sequences (CDS, upper-right) and transposable elements (TE, lower-left) among development stages listed in the chronological order. Coloured points are significantly differentially methylated CDS (green) and TEs (pink) between stages (Student’s T test, p<0.01). The methylation level (log counts per million, x axis) and its variation (log fold change, y axis) are shown.

